2014 survey results
Following the 2012 survey which gather 99 answers, I wanted to have a fresh picture on who are OpenRefine users. The 2014 survey received 129 answers on the span of two weeks. The goal of this second survey was to understand who is OpenRefine audience and what are they relationship with the official community tools (mailing list and Github issue trackers.)
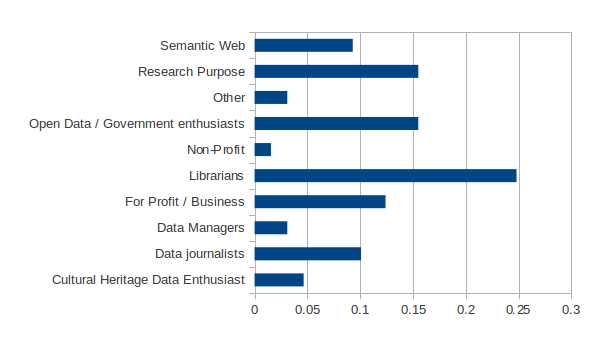
Community you identify with
One of four OpenRefine user identified himself as librarians making this group the the largest of OpenRefine user base. The Researcher and Open Data enthusiasts represent the two second largest group, each representing over 15% of the userbase. Finally Data journalist and Semantic web each represent around 10%.
We cannot compare directly those results with those from 2012 because in 2012 survey users were able to select multiple answer. However we can notice that in 2012 librarians were not identified as a individual group and are now the largest one.
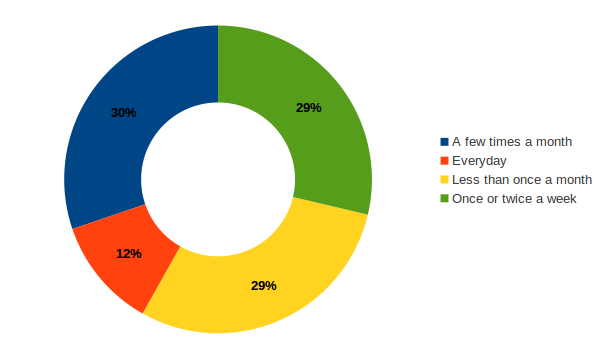
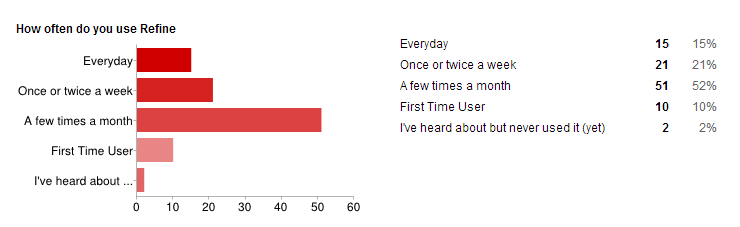
How often do you use Refine
Taking a slight higher picture the split a 41% using it weekly, a 30% monthly and a 29% less than monthly. Usage frequency remains globally the same between 2012 and 2014.
2014 Results
2012 Results
For how long have you been using OpenRefine
The split of users remains constant between 2012 and 2014 with
- a third of them using Refine for over two years,
- a third between one and two years and
- a third using OpenRefine for less than one year.

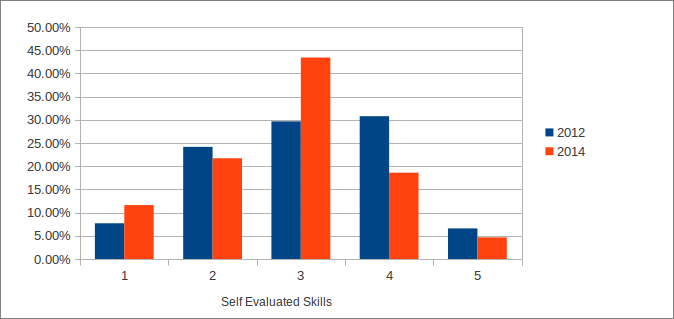
Skills
Both in 2012 and 2014 we asked respondents to rate their skills from one to five. One being a novice in Refine and five being a master. When comparing the result we can see a sharp increase in 2014 of the percentage of user with a skills self evaluated at 3. They represent today 43% of OpenRefine user base. It is interesting that the number of user rating their skills 5 (6 users) and 4 (28 in 2012 and 24 in 2014) remained the same over time.
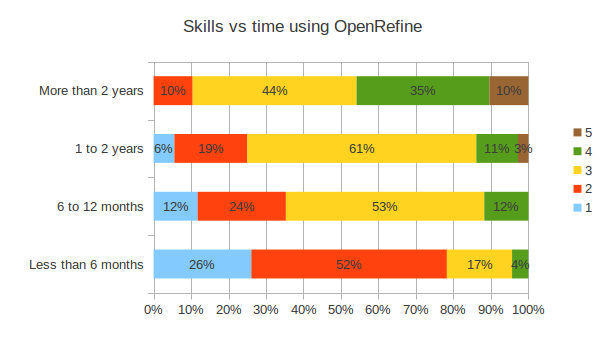
Skills vs time
At a high level, the more experienced user are the higher they will rate their skill. It takes between 6 months for user to take advantages of OpenRefine. This is only after this time period that user move their skills from a 2/5 to a 3/5. After two years of usage no user rate his skills 1/5.
On this other side, it take time to master OpenRefine as the proportion of user rating their skills 4 or 6 really increase after two years of usage with still over 50% rating their level between 2 and 3.
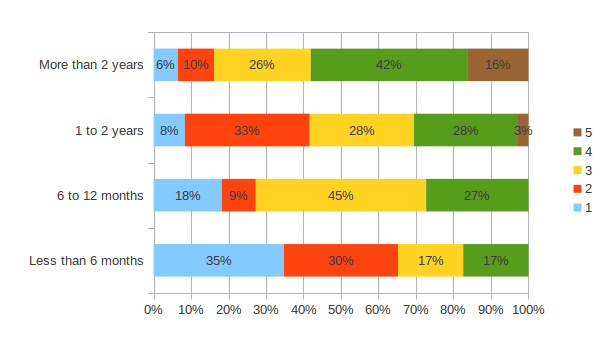
2012 picture is a bit harder to read with because the rating 3/5 is not as prominent as in 2014. However we can see the same trend with the increase of skilled user over time.
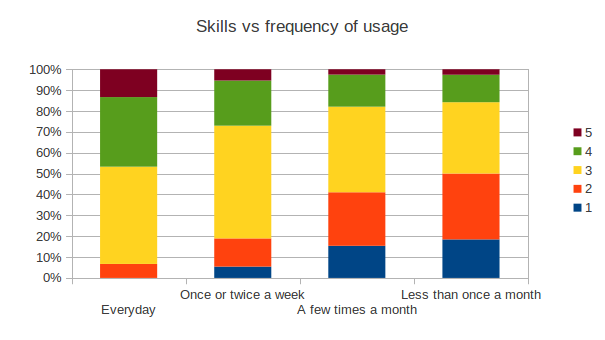
Skills vs frequency
Very briefly, the more often people use it the better their skills are.
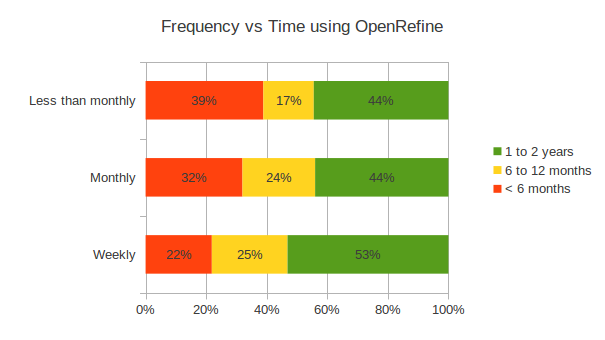
Frequency vs time
User over two years of experience tends to use it more often but there is no correlation between how long the user has been using OpenRefine and the frequency of usage. As we have seen previously, about 47% of them use it weekly, a third monthly and between 20% and a third less than monthly.
Seeking support
General overview
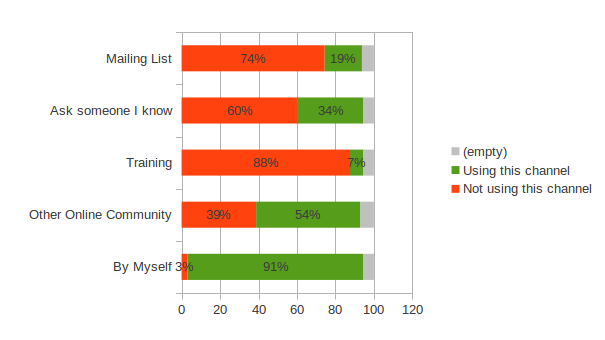
By order of importance when people need support
- they first learned how to use OpenRefine by themself (91%) using online tutorial or by exploring the interface.
- 54% reach to online community (but not the OpenRefine mailing list)
- 34% asked someone they know
- Only 19% use the mailing list
- and 7% have attended a formal training.
It could be interesting to know who are those other online community that provider support for 54% of OpenRefine users.
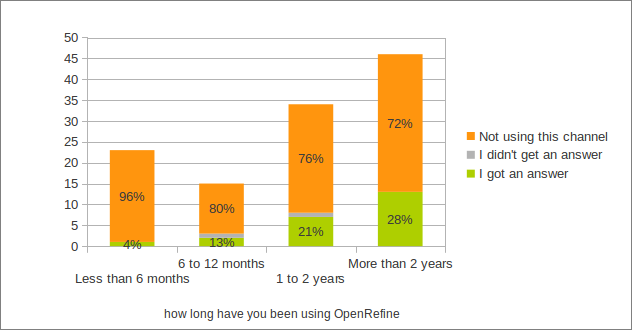
Usage of the mailing list
We can notice that only 19% of the user are reaching out through the mailing list which is supposed to be main media of communication for the community. When we drill down on who is using the mailing list we realized that this is mainly user with over a year of experience that are using this media. The graphic below show the percentage of user using the mailing list broke down by how long they have been using OpenRefine.
Reporting bugs and requesting new features
Because results are similar for the bug reporting and new feature request, the following analysis will be focus only on the bug reporting answers.
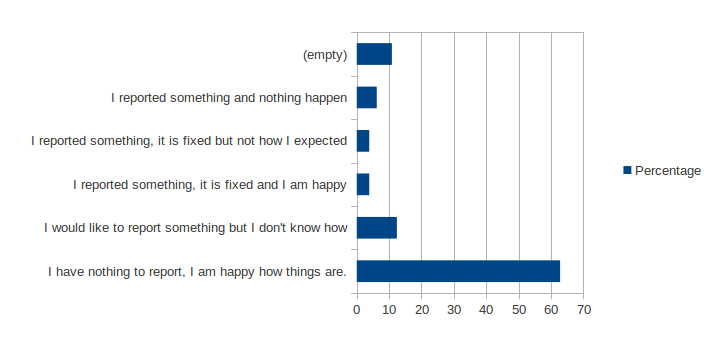
Overview
Close to 63% of the user are happy with OpenRefine and have nothing to report. However 11% of them want to report something but don't know how. Two hypotheses can be explore:
- Github is too complex for some user to report issue
- The project is missing links and instruction to report issue and request new feature.
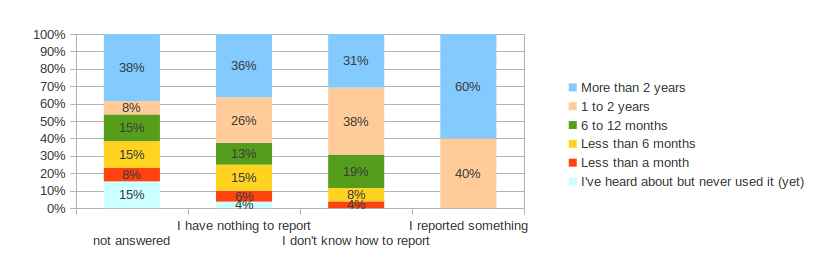
Breakdown per experience with Refine
The following graphic shows that only user with over one year experiences with OpenRefine have reported bug or request new feature. Surprisingly over 60% of the user don't know to report something have been using Refine for over a year.
Breakdown per skills
The following graphic shows that the ability to report is not linked with the skills level since user with a skill level of 4 doesn't know how to report. It is interesting that nearly all user self evaluated at 5 did report bug or request feature.
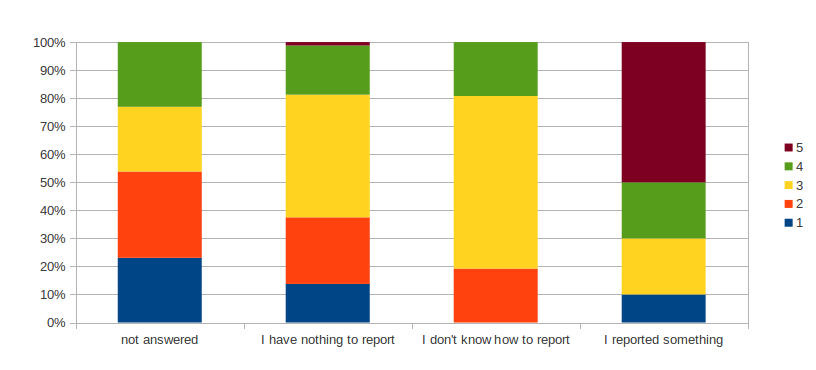
Even user with experience using Refine have difficulties to report bug and request new features. Better guidance is needed and this can be done by either improving
- OpenRefine interface with direct link to Github issue list
- OpenRefine wiki or website with a page describing the process.
Perception of Refine:
Why did you choose OpenRefine
Both in 2012 and 2014 OpenRefine is chosen for its easy and powerful interface to clean large dataset offering reconciliation option. The fact the project is free and open source is also important for a number of user.
2012
2014
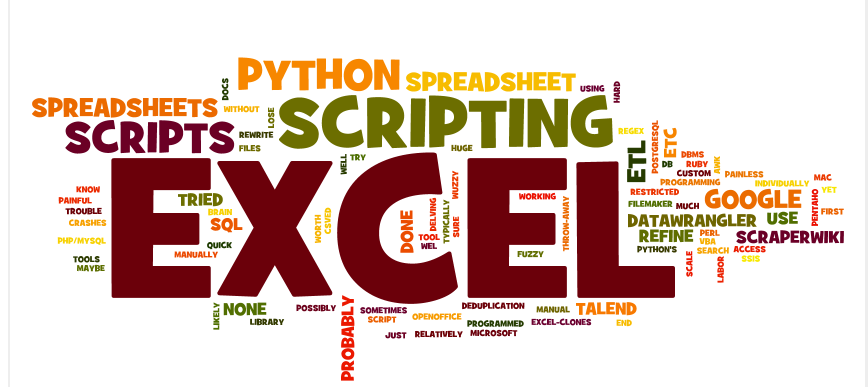
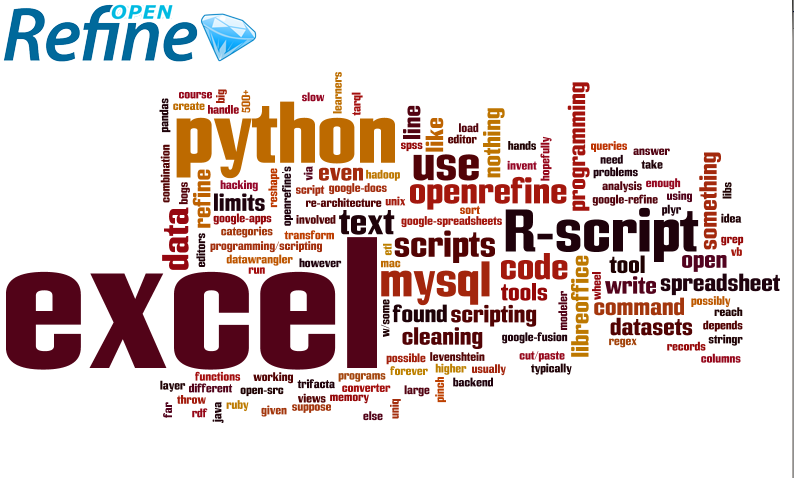
Alternative tools
As in 2012 the tools OpenRefine is benchmarked against split into programming / scripting languages (python, R, MySQL) and spreadsheet based interface like Excel or LibreOffice.
2012
2014
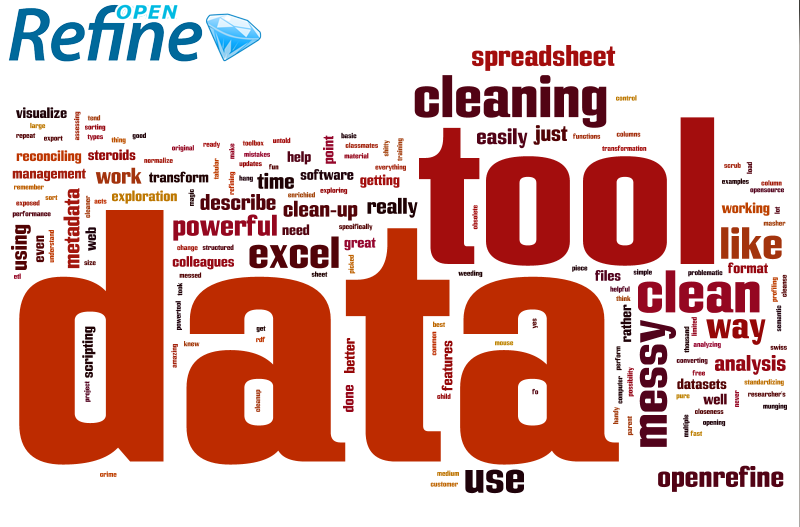
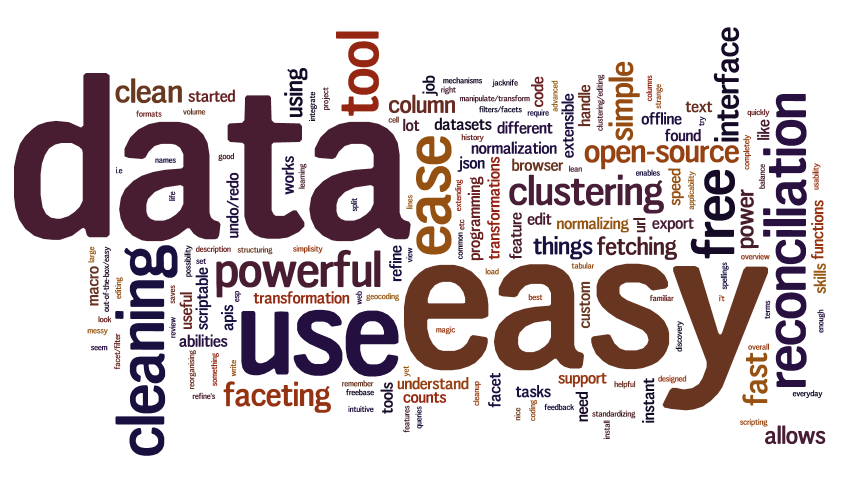
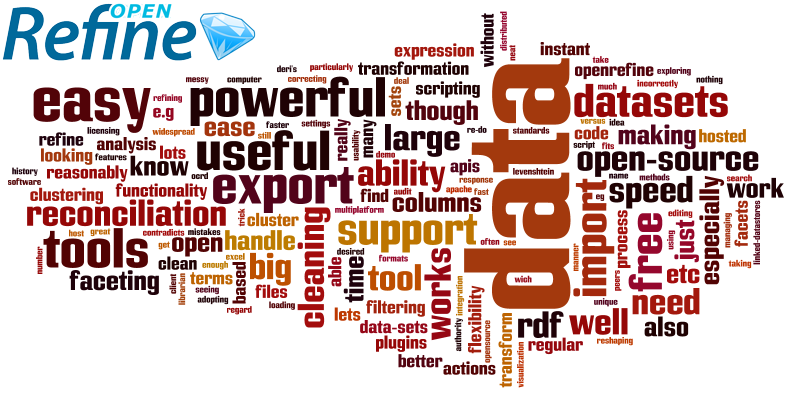
Word used to describe OpenRefine
OpenRefine is describe as a data cleaning tool.
2012
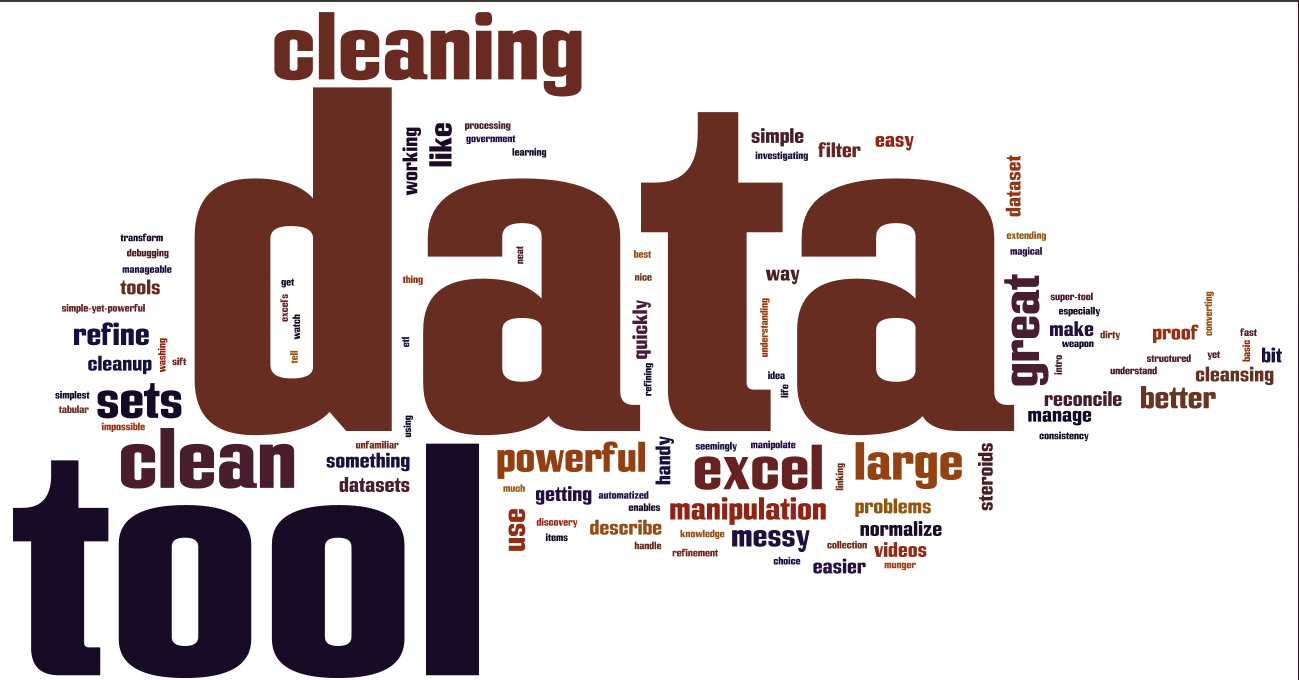
2014